Where should IoT data be processed – part 2

I wrote a post a while back on Where IOT data should be processed – part 1. We will get back to that post in a moment, but recently I read an article (How big data forced the hunt for ET intelligence to evolve) that mentioned after 20 years, they were shutting down SETI@home.

SETI@home was a crowdsourced computational network that took snippets of radio spectrum, sent them to 1000s of home computers to be analyzed during idle computer time, once processed the analysis was sent back to SETI@home. It was one of the first to use a crowdsourced approach to perform data processing. The data was collected at a radio telescope, sent to SETI@home and distributed from there.

6 Factors for IOT data processing

In my post I talked about 6 factors that should help determine where data is processed. Those 6 factors included

  • Data size which is a measure of the amount (GB, TB or PBs) of data that is being generated at an IOT node
  • Data pipe availability, which is all about the networking bandwidth that’s available at the IOT node. If we are talking some sort of low-bandwidth networking access then it probably makes sense to process the data more locally and send only results of processing up the stack.
  • Processing criticality which indicates how important is the processing of the data. If the processing could save a life then maybe it should be done as close as possible to where the data is generated. If the data processing is less critical it could perhaps be done at other nodes in an IOT network
  • Processing time and infrastructure cost which is all about what sort of computational resources are required to perform the processing and how much would it cost. If processing of the data is to undergo multiple passes or requires multi-core CPUs or GPUs, moving data off the IoT node and onto a more comprehensive server to process it, could make sense.
  • Compliance, governance and archive requirements, which discussed the potential need for all data to be available for regulatory audits and as such may need to be available at a central location anyway so why not perform processing there.
  • Data information funnel, which talked about the fact that an IoT network should be configured in layers and that each layer in the stack should probably be responsible for some portion of the data processing needed by the overall system, if nothing more than compressing the information before it is sent elsewhere.

Now that I review the list, the last, Data information funnel, factor really should be a function of the other factors rather than a separate factor.

In that blog post I promised to follow it up with some examples of the logic applied to real world problems. SETI is the first one I’ve seen in the literature

SETI’s IoT processing problem

Closeup front view of one antenna of the Allan Telescope Array, a radio telescope for combined radio astronomy and SETI (Search for Extraterrestrial Intelligence) research being built by the University of California at Berkeley, outside San Francisco. The first phase, consisting of 42 6 meter dish antennas like the one shown here, was completed in 2007. Eventually it will have 350 antennas. This type of antenna is called an offset Gregorian design. The incoming radio waves are reflected by the large parabolic dish onto a secondary concave parabolic reflector in front of the dish, and then into a feed horn. A metal shroud can be seen along the bottom of the secondary reflector which shields the antenna from ground noise. It covers the frequency range from 0.5 to 11.2 GHz.

The SETI researchers found that “The telescopes are now capable of producing so much data that it’s not possible to get that volume of data out to volunteers,” And “The discovery space is in these massive, massive data streams. And it’s just not efficient to distribute many terabits per second out to volunteers all over the world. It’s more efficient for that data processing to happen at the actual observatory.”

So they moved the data processing for the SETI IoT network from being distributed out to home computers throughout the world to being done at the (telescope) source where the data was originally generated.

This decision seems to rely on a couple of the factors above. Namely the pipe availability and data size factors. They had to move processing because no pipes existed to send Tb of data to 1000s of home computers. And finally, the processing time and infrastructure cost has come down so much, that it was just easier to do the processing onsite.

It doesn’t seem like processing criticality or compliance-governance-archive had any bearing on the decision.

So there’s the first example that seems to fit well into our data processing framework.

~~~~

We ought to be able to come up with a formula that uses all these factors and comes up to with a yes or no as to whether to process the data on the node or not.

Photo Credit(s)

Undersea datacenter in our future?

Read about Microsoft’s Project Natick Phase 2 this past week. Microsoft submerged a steel encased tube filled with servers, storage and compute for 2 years in the UK and just took it out of the water this past July. We’ve written before about underwater and in space data centers (see our IT in space post)

Project Natick’s Phase 2 underwater data center had 12 racks with 864 servers and 27.5PB of disk storage and was connected to the nearby Orkney island’s power grid (250Kw) and networking infrastructure. The Orkney’s islands are located off the NE coast of the Scotland and its power grid is 100% renewable, using tidal, solar and wind power. During the data center test, Orkney was able was able to power the data center, the islands and still provide power back to the Scottish power grid.

More reliable underwater

According to early reports, the servers in the underwater data center had 1/8th the failures that a control data center, on land, had. Microsoft attributes the enhanced server reliability to the use of a 100% Nitrogen (at 1 atmosphere pressure) rather than normal air and the lack of any humans to jostle the equipment/disturb the environment.

It’s also likely that the temperature variability present in a normal, on the surface of the earth, data center was measurably less than for a data center on the sea floor. If this were true, that could also help explain its better reliability.

Why underwater?

It’s all about cooling modern servers (and storage). According to NREL ( USA National Renewable Energy Lab), most data centers operate at 1.8 PUE (power use efficiency) that is, using 180% of the power required for the servers, storage and networking equipment. The other 80% is used mainly for cooling electronics, but also includes lighting, HVAC, and other essential services for humans. NREL says that high efficiency data centers can achieve a PUE of 1.2.

PUE for Project Natick Phase 2 data center was reported to be 1.07. The only additional electricity needed would probably be power for cooling.

Cooling for the Project Natick Phase 2 data center used seawater pumped through the back of server racks. The data center was placed on the seafloor at 35m (117ft) deep.

It kind looked like a submarine. According to Microsoft, the data center was contracted for, built and deployed in under 90 days. The intent was to have the data center be smaller than a standard ISO shipping container. The data center was driven ontop of an 18 wheeler, from where it was built to the Orkney Island, including ferry crossings. It was placed on a triangular support, towed out to see and deposited on the seafloor.

While 864 servers and 27.5PB of storage seem like a lot to most of us, for Microsoft Azure it’s too small to be used as a regional zone. But for (large) edge deployments. something this size or (10X) smaller might be just the thing.

Microsoft notes that 1/2 the world’s population lives within 200km (120mi) of the ocean. So there’s a ready supply of people and businesses that could take advantage of any underwater data center.

And of course, such a structure when laid on the bottom of the ocean floor, could create an artificial reef (if left in place long enough). Artificial reefs have been made out of ocean oil rigs, sunken war ships and large chunks of steel/concrete. So a underwater data center could do so just as well. And maybe the heating coming from the data center cooling pumps would foster even more coral life.

Microsoft plans Project Natick Phase 3 to be a full Azure AZ that will be deployed underwater which will include about 12 Phase 2 datacenter pressurized units.

Photo Credits:

AI ML DL hardware performance results from MLPerf

Read an article a couple of weeks back from IEEE Spectrum, New Records for AI Training which discussed recent MLPerf v0.7 performance results. The article mentioned that MLPerf performance on its benchmarks has increased by ~2.7X in the last year alone.

The MLPerf organization was started back in 2018 to supply machine learning workload performance results, somewhat like what SPEC and TPC did for NFS and transaction processing. The MLPerf organization documented their philosophy in a paper.

But first please take our new poll:

As far as I can tell, MLPerf is the only benchmark currently available to show hardware system performance on AI training and inferencing. Below we report on MLPerf training results.

MLPerf also reports on both closed and open division benchmark results. Closed division submission all use the same software algorithms for each workload submission. This way one can compare workload performance across different hardware systems. Open division results can make use of any algorithm to achieve the desired results on the problem set. We report on MLPerf closed division results below.

Current MLPerf v0.7 (open and closed division) training results are available online (on GitHub) and are summarized in a training results page on their web site.

MLPerf v0.7 workload changes

The MLPerf team added a few new workloads and upped the game of another benchmark for V0.7

  • Recommendation DLRM: a replacement for what was used in MLPerf v0.6 and is from Facebook providing more parallelism in training for recommendations.
  • Wikipedia BERT: an addition to what was used in MLPerf v0.6 and is a new natural language processing (N?P) frontend, trained on Wikipedia which is used with other language processing capabilities.
  • Go MiniGo: an enhancement to MLPerf v0.6 MiniGo accuracy requirements and uses reinforcement learning to learn to play Go well enough to achieve a 50% win rate. For v0.7, they now use a full sized, 19X19 Go board and upped the win rate requirement to 50%.

MiniGo Results

A couple of items of note for the MiniGo results. There are essentially 3 different architectures represented in the above: NVIDIA DGX series (DGX A100, DGX-2H, DGX-1), Google TPUs (V4 and V3) and Intel (8 server nodes with Copper Lake-6 CPUs).

Google TPUs are considered internal and are only available to Google, its hardware partners or on GCP. Although MLPerf include GCP TPU system results for other workloads, there were none submitted for MiniGo.

The Intel system is a preview of their latest gen Copper Lake chips, which may not be commercially available yet. On the other hand, all NVIDIA systems are commercially available and can be deployed in your data center today.

As one can see in the above, NVIDIA systems swept the first 3 positions on our Top 10 MiniGo chart. A DGX A100 came in at #1, reaching a 50% win rate at MiniGo in mere 17 seconds using 448 CPUs and 1792 A100 GPUs. Coming in at #2 at 30 seconds was another DGX A100 using 64 CPUs and 256 A100 GPUs. And at #3 at 35 seconds was a DGX-2H using 64 CPUs and 512 V100 GPUs.

Next at #4 at 151 seconds was a Google TPU system with 64 TPUv4 accelerators (unclear how many CPUs, if any are used, results show 0). Note, an 8-node Intel server with the 32 CPUs (4/node) using the latest gen Copper Lake (-6) CPU came in at #7 using 409 seconds to achieve the training results.

There are 6 other MLPerf workloads including DLRM and BERT mentioned above. Each of these deserve their own discussion on top ten results. Alas, they will need to wait for another time and I will cover all of them in future posts.

~~~~

Nowadays, with much of IT turning to AI ML DL to provide critical services, it’s more important than ever to understand what can and can’t be done with available hardware. The fact that one can train a model to play decent Go in 17 seconds on a large DGX A100 cluster and under 7 minutes on an 8-node, leading edge, Intel server cluster is pretty impressive.

Despite MLPerf’s best efforts, it’s still tough to compare ML performance across systems when there’s so much diversity in the underlying hardware, especially in GPU, TPU and CPU counts. IMHO, it would be very useful to have a single GPU , TPU or CPU system submission requirement for each workload. That way one could compare how well each hardware element can perform the workload in isolation.

Nonetheless, the MLPerf suite of benchmarks provides a great first step in understanding what today’s hardware can accomplish in ML training (and inferencing).

Comments?

Photo Credits:

Open source ASICs – Hardware vs. Software innovation (round 5)

A good friend of mine sent me an article yesterday (Produce your own physical chips for free, in the open) that announced a collaboration between Google, Skywater Technology Foundry and FOSSi (Free and open source silicon) Foundation that ultimately supplies a completely open source set of tools to create ASICs at 130nm node ASIC level. The last piece of this toolkit was an open source PDK (Process Design Kit) data that was produced by Google-Skywater technologies and their offer for free fab services to manufacture chips that were designed with the tool set.

Layout snapshots of 2D and 3D ICs designed in 130-nm process technology: (a) 2D IC (2D-130); (b) the top and bottom tiers of a 3D IC using macro-level partitioning (3D-MP-130); and (c) the top and bottom tiers of a 3D IC using pipeline-level partitioning (3D-PP-130). 

The industry and I have had a long term discussion in this blog and elsewhere about the superiority of hardware innovation vs. software innovation using commodity hardware (e.g., see TPU and hardware vs. software innovation (Round 3) and Hardware vs. software innovation – Round 4). Most of the tech industry believes that software innovation on commodity hardware is better than hardware innovation. We beg to differ and in our mind, it’s the combination of hardware AND software innovation that is remaking the world.

Much of this can be seen with smart phone technology. The smart phone would not be possible without significant hardware innovation and has supplied ubiquitous computing for the world. That is it has connected billions to the internet that had no connection before.

But historically, hardware innovation has been hard to do, took a long time, and costs a lot vs. software innovation with commodity hardware, which by definition, is easier to do, takes almost no time (with continuous innovation even less) and costs almost nothing, especially when using open source.

The one innovation that emerged over the last few decades to make new hardware creation easier, has been the FPGA. FPGAs allow for “programing” hardware logic in the lab (sometime in the field) rather than having it be set in silicon in the fab. The toolchains to support FPGA programming can be proprietary but some are also available in open source. For example, SymbiFlow (open source) takes in Verilog (IEEE standard hardware definition language) and converts it into a binary bit stream used to program most (Xilinx-7 and Lattice) FPGAs.

But this recent announcement makes the process to create ASICs completely open source and much easier and cheaper to do

ASICs design flow

Prior to this announcement, most PDKs were expensive and specific to a particular FAB and process node. With Google’s and Skywater’s release of open source PDK (on GitHub) data, designers and engineers now have a completely open source tool kit that is they have RTL (Register-transfer-level, hardware description logic) design tools, EDA tools and PDK data to create their own ASICs. And with this toolkit Skywater together with Google will manufacture ASICs for you, at no cost.

The FOSSi dial up talk (embedded in the announcement above) goes into much detail about the FPGA and ASIC tool chain. but prior to this announcement the PDK data which is used to help the RTL and EDA tools simulate, verify and determine the optimum layout for the hardware design was always proprietary.

Open source RTL tools have been available for years now starting with OpenCores, OpenRISC, RISC-V and now OpenPower. RISC-V and OpenPower include RTL to implement sophisticade instruction set CPUs. OpenRISC is RTL for a precursor to RISC-V and OpenCores supplies the RTL for a number of other (CPU) cores. But this is just a sample of the RTL that’s available in open source.

EDA Tools are also available in open source. The most recent incarnation would be the DARPA funded, OpenROAD project. OpenROAD will ultimately provide a completely open source EDA Tool set for electronic design. The first component of this is a set of EDA tools that convert RTL to GDS II (industry standard graphical design stream description of a IC chip componentry and layout). GDS II streams are used to create masks for IC fabrication.

And now with the open source Google-Skywater PDK data, one has a complete open source tool chain to create ASICs at the 130nm node level for the Skywater Fab in Minnesota.

A PDK contains a lot of data about the ASIC fabrication process including process design rules, analog and digital design cells and models, behavioral models for analog and digital design, extracted data for simulation and other supporting functionality.

The Google-Skywater Technologies open source PDK is Apache 2.0 Licensed. The PDK is used in the SKY130 process node, which includes 130nm technologies, high voltage support, 5 metal layers and one interconnect layer.

At the moment the PDK includes standard digital cell support (“nor” gates, “and” gates, flip flops, etc.) but over time they are planning to add analog cells, IO & periphery cells, analog RF as well a fully automated design rule checking, with SRAM/flash build spaces.

The PDK does include standard SRAM bit cells and in combination with OpenRAM project one can use SRAM cells to create SRAM memory for the ASIC.

Google-Skywater are going to be fabricating, for free, up to 40 ASIC designs starting in Fall of 2020 and then six months later, they will start fabricating ~40 ASICs ever 3 months.

However to qualify for free fabrication, your design has to be completely open source (located on GitHub). To submit your ASIC you need to send your public GitHub URL repository to efabless and they will perform verification processes on it. If it works, they will respond with an email that it was accepted. If more than 40 designs are submitted for a run, the Google-Skywater team will decide on which 40 will be manufactured

The 16mm**2 ASIC automatically comes with a RISC-V CPU, RAM and power plus ~40 IOs. There is another 10mm**2 space for all of your ASIC specific logic. If successful, you will get back ~100 to 400 packaged chips.

~~~~

ASICs were always lengthy and costly to design and then fabrication took more money and time, before you got anything back to test. With Open source tool kits, design should no longer cost anything but engineering time and with the sophistication available is todays toolchain, should not be that lengthy. And if your one of the lucky 40 designs, ASIC fabrication is free. And then starting next year fabrication runs will occur every 3 months. So you could potentially get your design back in an ASIC in as little as 3 months.

And while the 130nm technology node dates back to 2001-2003, there were plenty of sophisticated ASICss made during those years (at a previous job, we did a couple ourselves). And of course, with your very own RISC-V CPU inside, you could pretty much do anything you want with your ASIC. Yeah RAM, SRAM and other constraints may limit you, but that’s what hardware innovation is all about, deal with the physical constraints but open up a whole new architectural world.

Welcome to the a new era of ASIC (hardware) innovation.

Photo Credit(s):

Software defined power grid

Read an article this past week in IEEE Spectrum (The Software Defined Power Grid is here) about a company that has been implementing software defined power grids throughout USA and the world to better integrate and utilize renewable energy alongside conventional power generation equipment.

Moreover, within the last year or so, Tesla has installed a Virtual Power Plant (VPP) using residential solar and grid scale batteries to better manage the electrical grid of South Australia (see Tesla’s Australian VPP propped up grid during coal outage). VPP use to offset power outages would necessitate something like a software defined power grid.

Software defined power grid

Not sure if there’s a real definition somewhere but from our perspective, a software defined power grid is one where power generation and control is all done through the use of programatic automation. The human operator still exists to monitor and override when something goes wrong but they are not involved in the moment to moment control of which power is saved vs. fed into the grid.

About a decade ago, we wrote a post about smart power meters (Smart metering’s data storage appetite) discussing the implementation of smart meters for home owners that had some capabilities to help monitor and control power use. But although that technology still exists, the software defined power grid has moved on.

The IEEE Spectrum article talks about a phasor measurement units (PMUs) that are already installed throughout most power grids. It turns out that most PMUs are capable of transmitting phasor power status at 60 times a second granularity and each status report is time stamped with high accuracy, GPS synchronized time.

On the other hand, most power grids today use SCADAs (supervisory control and data acquisition) to monitor and manage the power grid. But SCADAs only send data every 2-4 seconds. PMU’s are also installed in most power grids, but their information is not as important as SCADA to the monitoring, management and control of most (non-software defined) power grids.

One software defined power grid

PXiSE, the company in the IEEE Spectrum article, implemented their first demonstration project in Hawaii. That power grid had reached the limit of wind and solar power that it could support with human management. The company took their time and implemented a digital simulation of the power grid. But with the simulation in hand, battery storage and a off the shelf PC, the company was able to manage the grids power generation mix in real time with complete automation.

After that success, the company next turned to a micro-grid (building level power) with electronic vehicles, battery and solar power. Their software defined power grid reduced peak electricity demand within the building, saving significant money. With that success the company took their software defined power grid on the road to South Korea, Chile, Mexico and a number of other locations the world.

Tesla’s VPP

The Tesla VPP in South Australia, is planned to consists of up to 50K houses with solar PV panels and 13.5Kwh of batteries, able to deliver up to 250Mw of power generation and 650Mwh of power storage.

At the present time, the system has ~1000 house systems installed but even with that limited generation and storage capability it has already been called upon at least twice to compensate for coal generation power outage. To manage each and every household, they’d need something akin to the smart meters mentioned above in conjunction with a plethora of PMUs.

Puerto Rico’s power grid problems and solutions

There was an article not so long ago about the disruption to Puerto Rico’s power grid caused by Hurricanes Irma and Maria in IEEE Spectrum (Rebuilding Puerto Rico’s Power Grid: The Inside Story) and a subsequent article on making Puerto Rico’s power grid more resilient to hurricanes and other natural disasters (How to harden Puerto Rico’s power grid). The later article talked about creating micro grids, community PV and battery storage that could be disconnected from the main grid in times of disaster but also used to distribute power generation throughout the island.

Although the researchers didn’t call for the software defined power grid, it is our understanding that something similar would be an outstanding addition to their work there.

~~~~

As the use of renewables goes up and the price of batteries decreases while their capabilities go up over time, more and more power grids will need to become software defined. In the end, more software defined power grids with increasing renewables power generation and storage will make any power grid, more resilient and more fault tolerant.

Photo Credit(s):

Thoughts on my first virtual conference

I attended a virtual event this week. It was scheduled to last 3 hours. But I only stayed for 2.5 Hours. Below I describe the event from my perspective and after that some notes on how it could be made better.

The virtual event experience

The event home page had a welcome video that you could start when you got there. I didn’t have any idea what to expect so this was nice. It could have spent time discussing the mechanics of the site and how to attend the event but it just was a welcome video, welcoming me to the event and letting me know they appreciated me being able to attend.

Navigation on the site wasn’t that easy to figure out at first. It was at the bottom of the page not at the top or the side. And the navigation home button brought up a list of videos that you could watch (or attend). And that page was in front of the conference page.

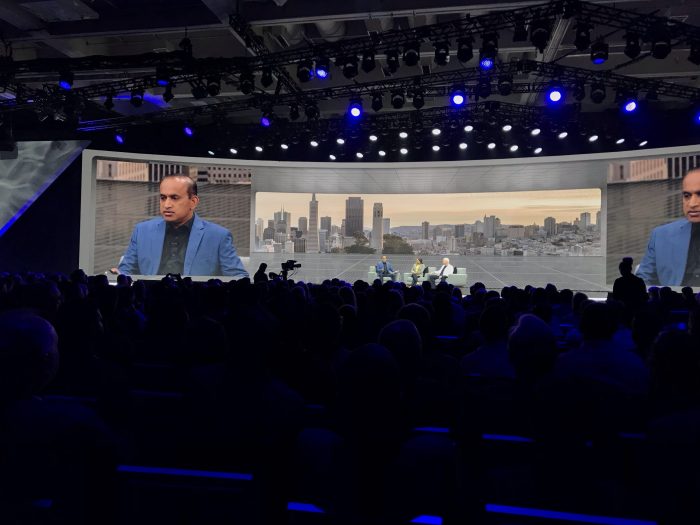
I launched the 1st (actually 2nd after the welcome video) which was the CEO keynote session. I thought this was good and the occasional interruption by executives ringing the CEO’s doorbell asking for toilet paper was entertaining. Again he welcomed us to the event and discussed how the pandemic has changed their world and ours. He thanked the customers in attendance and made brief mention of the video (tracks) that one could follow. I don’t recall but the CEO keynote didn’t seem to have any (or many) slides during his session it was just like an informal talk (but) scripted.

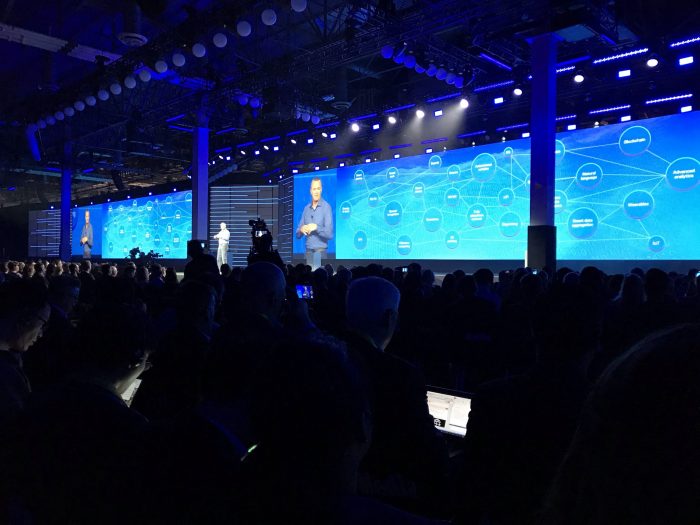
It took me a while to figure out how to get back to the main agenda page but once there I proceeded on my chosen track to watch the next video. When I was finished with that I watched the other 3 track videos. The video tracks were not as good as the CEO keynote session and some of them had many more slides than they needed.

They also had a customer interview with an exec which was great and well done. Especially given it seemed to have been recorded over the prior 48 hours.

Somewhere in all of this, I happened to reach the Expo floor. It had a series of technical break out sessions and then the exhibitor buttons which had their own videos, reports, webinars that one could watch/read.

I watched most of the technical breakouts (at least part way through). The tech breakouts were ok, but also had mixed quality as I remember it. That is some having more or less slides and more or less webinar like.

I also watched a few of the exhibitor videos. Some of these auto started when you clicked on their expo buttons, some did not. Some videos were very loud while others were fine.

I’d say the mixed quality of the exhibits were similar to what one might see at any conference with bigger vendors having more polished content while smaller vendors had less polished content.

The conference had a public chat channel but there was one channel for the whole conference and it didn’t appear until much later (maybe when I entered the first breakout sessions or expo “hall”)

How to make our next virtual conference better

Below are my thoughts on ways to improve the virtual conference experience.

• Have real scheduled times to watch the videos/webinars/tech sessions. Yes there all online and can truly be watched at any time you want. But I expected a scheduled agenda with breaks between sessions and to have to pick which one I wanted to go to, meaning that some would have to be unattended. I would suggest that the videos only be available during the event at scheduled time slots and that the event organizers build in breaks between each session. They could always be made available at a later date under a conference media page for further viewing but having them scheduled to run in a conference room would make it more conference like. The tracks could be scheduled in other side rooms of the conference.

• Also, would it be too much to ask that they have some sort of video roll call of participants with headshots and maybe a title. Something akin to a conference badge. Perhaps they could show this during the breaks between sessions. Even if you rolled through the virtual badge shots quickly, during breaks, it would act as sort of an analog of walking from one session to another.

• I don’t know whether there was any interest in social media, but having a twitter, facebook, other social media event hash tag prominently displayed on the bottom 1/3rd or on some early slide deck would have been useful. To generate some social buz

• Also, at conferences, one can typically see a screen which tracks the social media hash tag. I saw none of this at the event. Having some small panel running social media activity might have led to more social media interaction. It could be along the side of the main page, viewable during all videos, breaks and other sessions.

• As for the public chat. I think it would have been better to have a separate chat channels for each video, breakout, exhibit, etc. rather than having a single chat room for the whole conference. It would have been great if the separate chat window popped up when you started viewing a video, breakout or entered an exhibit.

• Have lots more technical breakouts. didn’t see a great quantity of these maybe 5-7 tech breakouts and the 4 original tech track videos. Again separate chat channels so one could ask questions pertaining to the session would have been great.

• The exhibits were all other vendors (sponsors) showing there stuff. I didn’t see any show and tell for the conference event organizers that one would see in any conference if you walked out on the show floor. Would it have been to much to ask to have a virtual walk through tour of each of the conference organizers products and a couple of demos of their products/services. Just like one could see at any conference.

• The expo floor exhibitor sessions could be left available to view anytime the event was “open” but the tech breakout sessions would be available multiple times a day but scheduled just like any other event sessions. And it would be nice to have a separate chat channel for each expo exhibitor and tech break out sessions., so we could ask questions of their staff.

• Another thing available at most conference events is a social media booth where bloggers, podcasters, and vloggers could sit around and talk about the event and their products and whatever else came to mind. I didn’t see anything like this and having a separate chat window for these booths would be useful.

• Also, it would be nice if one could obtain vendor certifications or a detailed tutorials on some product/service.

• On a personal note, I am an industry analyst it would be nice to have a separate analyst track. I come to these events to have face time with execs and get a download on what their upcoming strategy is and how they did over the last year or so. Yes these could all be done offline but they could also be accomplished during the event with its own secure chat channel

• I’m also an influencer. So having a separate press track would have been great as well. Often the analyst and press track overlap for a couple of sessions and then go there separate (NDA) ways.

• For both the analysts and the Press/influencers having a live Q&A session with the execs, technical team, and select customers would have been great. But alas there was nothing like this. But with a separate secure chat room this could have also been done.

• I can’t stress enough that the conference event navigation needs to be better and more intuitive.

I know that there’s a lot here and there’s probably a whole bunch more that could be done better. Other people will no doubt have their own opinions. But these are mine.

It was the first virtual conference (I attended) and the vendor sort of played iit by ear and designing it almost in real time. Given all that, they did a great job. Now it’s time to do better.

I’m a conference geek. I go to an average of 10 or more vendor conferences a year so this is a major part of what I do.

IMHO, nothing besides ubiquitous, true virtual reality will ever replace the effectiveness of in real life conferences. That being said, there are ways to make current virtual events come closer to real conferences.

~~~~

I thought about sending this to the conference organizers but their conference is over, and hopefully next year it will be back IRL. But there’s plenty more virtual conferences left on my schedule for this year.

I would prefer all of them to be done better, for me, analysts, press/influencers and ultimately customers.

Were all in this together.

Comments.

Google Docs as subversive technology

Read an article the other day in TechReview (How Google Docs became the social media of the resistance) about how Google Docs was being used to help coordinate and promote the resistance surrounding the recent Black Lives Matter movement.

The article points out that Google Docs are sharing resources around anti-racism, email templates, bail resources, pro-bono legal assistance, etc. to help inform and coordinate the movements actions and activities.

Social unrest, the killer app for Google Docs

Protests could be the killer app for shared Google Docs. Facebook and other social media sites are better used for documenting the real time interactions during protests, but coordinating, motivating and informing the protests and protestors is better accomplished using Google Docs, a simple web based, document editor and sharing service.

In pre-internet days, I suppose all this would have been done on hand copied, typeset printed, carbon copied or photocopied theses/phamplets/fliers/printouts. For example, Luther’s list of grievances nailed to the cathedral door, Common Sense pamphlet during the USA revolutionary war to countless fliers during the 60’s protests, all these used the technology of the day to promote protest and revolution.

Nowadays all it takes is a shared Google Doc and a Google (drive) account.

Google Docs are everywhere

The high school that one of my kids went to uses Google Docs for sharing and submitting homework assignments.

Google Docs are shareable because they are hosted on Google Drives. Docs is just one component of the Google (G-)suite of web based apps that includes Google Sheets (spreadsheets), Google Slides (presentations) and Google Drives (object storage).

Moreover, any Google Doc, Sheet or Slide file can be shared and edited by anyone. And Google services like Docs, Sheets, and Slides are useable anonymously, Anyone onlin, can make a change to a shareable/editable doc, sheet, or slide and their changes are automatically saved to the google drive file.

Another thing is that any Google Doc can be shared with just a URL. And they can also be made read-only (or uneditable) by their owner at any time. And of course any Google Doc is backed up automatically by Google drive services.

Owners of documents can revert to previous versions of a Doc file. So if someone incorrectly (or maliciously) changes a doc, the originator can revert it back to a prior version.

Why not use a Wiki

I would think a Wiki would be better to use to coordinate, motivate and inform a protest. Once a Wiki is setup and started, it can be much easier to navigate, as easy to update, and can become a central repository of all information about a movement/protest.

But it takes a lot more effort and IT-web knowledge to set up a Wiki. And it has to have it’s own web address.

Another problem with a Wiki, is that it can become a central point which can be more easily attacked or disturbed. And Wiki edit wars are pretty common, so they too are not immune to malicious behavior.

But with 10s to 100s of Google Docs, spread across user a similar number of user Google drives, Google Docs are a much more distributed resource, less prone to single point of attack. And they can be created and edited almost on a whim. And the only thing it takes is a Google log in and Google drive.

~~~~

Photo copiers were a controlled technology in the old Soviet Union and even today facebook and twitter are restricted in China and other authoritarian states.

But Google Doc’s seems to have become a much more ubiquitous tool and have become the latest technology, to aid, abet and support social resistance.

Photo credit(s):

Societal growth depends on IT

Read an interesting article the other day in SciencDaily (IT played a key role in growth of ancient civilizations) and a Phys.Org article (Information drove development of early states) both of which were reporting on a Nature article (Scale and information processing thresholds in Holocene social evolution) which discussed how the growth of society during ancient times was directly correlated to the information processing capabilities they possessed. In these articles IT meant writing, accounting, currency, etc., relatively primitive forms of IT but IT nonetheless.

Seshat: Global History Databank

What the researchers were able to do was to use the Seshat: Global History Databank which “systematically collects what is currently known about the social and political organization of human societies and how civilizations have evolved over time” and use the data to analyze the use of IT by societies.

We have talked about Seschat before (See our Data Analysis of History post)

The Seshat databank holds information on 30 (natural) geographical areas (NGA), ~400 societies and, their history from 4000 BCE to 1900CE.

Seschat has a ~100 page Code Book that identifies what kinds of information to collect on each society, how it is to be estimated, identified, listed, etc. to normalize the data in their databank. Their Code Book provides essential guidelines on how to gather the ~1500 variables collected on societies.

IT drives society growth

The researchers used the Seshat DB and ran a statistical principal component analysis (PCA) of the data to try to ascertain what drove society’s growth.

PCA (see wikipedia Principal Component Analysis article) essentially produces a list of variables and their inter-relationships. Their combined inter-relationships is essentially a percentage (%Var) of explanatory power in how much those variables explains the variance of all variables. PCA can be one, two, three or N-dimensional.

The researchers took Seshat 51 society variables and combined them into 9 (societal) complexity characteristics (CC)s and did a PCA of those variables across all the (285) society’s information available at the time.

Fig, 2 says that the average PC1 component of all societies is driven by the changes (increases and decreases) in PC2 components. Decreases of PC2 depend on those elements of PC2 which are negative and increases in PC2 depend on those elements of PC2 which are negative.

The elements in PC2 that provide the largest positive impacts are writing (.31), texts (.24), money (.28), infrastructure (.12) and gvrnmnt (.06). The elements in PC2 that provide the largest negative impacts are PolTerr (polity area, -0.35), CapPop (capital population, -0.27), PolPop (polity population, -0.25) and levels (?, -0.15). Below is another way to look at this data.

The positive PC2 CC’s are tracked with the red line and the negative PC2 CC’s are tracked with the blue line. The black line is the summation of the blue and red lines and is effectively equal to the blue line in Fig 2 above.

The researchers suggest that the inflection points in Fig 2 and the black line in Fig 3),represent societal information processing thresholds. Once these IT thresholds have passed they change the direction that PC2 takes on after that point

In Fig4 they have disaggregated the information averaged in Fig. 2 & 3 and show PC2 and PC1 trajectories for all 285 societies tracked in the Seshat DB. Over time as PC1 goes more positive, societie, start to converge on effectively the same level of PC2 . At earlier times, societies tend to be more heterogeneous with varying PC2 (and PC1) values.

Essentially, societies IT processing characteristics tend to start out highly differentiated but over time as societies grow, IT processing capabilities tend to converge and lead to the same levels of societal growth

Classifying societies by I

The Kadashev scale (see wikipedia Kardashev scale article) identifes levels or types of civilizations using their energy consumption. For example, The Kardashev scale lists the types of civilizations as follows:

  • Type I Civilization can use and control all the energy available on its planet,
  • Type II Civilization can use and control all the energy available in its planetary system (its star and all the planets/other objects in orbit around it).
  • Type III Civilization can use and control all the energy available in its galaxy

I can’t help but think that a more accurate scale for civilization, society or a polity’s level would a scale based on its information processing power.

We could call this the Shin scale (named after the primary author of the Nature paper or the Shin-Price-Wolpert-Shimao-Tracy-Kohler scale). The Shin scale would list societies based on their IT levels.

  • Type A Societies have non-existant IT (writing, money, texts, money & infrastructure) which severely limits their population and territorial size
  • Type B Societies have primitive forms of IT (writing, money, texts, money & infrastructure, ~MB (10**6) of data) which allows these societies to expand to their natural boundaries (with a pop of ~10M).
  • Type C Societies have normal (2020) levels of IT (world wide Internet with billions of connected smart phones, millions of servers, ZB (10**21) of data, etc.) which allows societies to expand beyond their natural boundaries across the whole planet (pop of ~10B).
  • Type D Societies have high levels of IT (speculation here but quintillion connected smart dust devices, trillion (10**12) servers, 10**36 bytes of data) which allows societies to expand beyond their home planet (pop of ~10T).
  • Type E Societies have high levels of IT (more speculation here, 10**36 smart molecules, quintillion (10**18) servers, 10**51 bytes of data ) which allows societies to expand beyond their home planetary system (pop of ~10Q).

I’d list Type F societies here but a can’t think of anything smaller than a molecule that could potentially be smart — perhaps this signifies a lack of imagination on my part.

Comments?

Photo Credit(s):