EMCworld 2013 Day 2

IMG_1382The first session of the day was with  Joe Tucci EMC Chairman and CEO.  He talked about the trends transforming IT today. These include Mobile, Cloud, Big Data and Social Networking. He then discussed  IDC’s 1st, 2nd and 3rd computing platform framework where the first was mainframe, the second was client-server and the third is mobile. Each of these platforms had winers and losers.  EMC wants definitely to be one of the winners in the coming age of mobile and they are charting multiple paths to get there.

Mainly they will use Pivotal, VMware, RSA and their software defined storage (SDS) product to go after the 3rd platform applications.  Pivotal becomes the main enabler to help companies gain value out of the mobile-social networking-cloud computing data deluge.  SDS helps provide the different pathways for companies to access all that data. VMware provides the software defined data center (SDDC) where SDS, server virtualization and software defined networking (SDN) live, breathe and interoperate to provide services to applications running in the data center.

Joe started talking about the federation of EMC companies. These include EMC, VMware, RSA and now Pivotal. He sees these four brands as almost standalone entities whose identities will remain distinct and seperate for a long time to come.

Joe mentioned the internet of things or the sensor cloud as opening up new opportunities for data gathering and analysis that dwarfs what’s coming from mobile today. He quoted IDC estimates that says by 2020 there will be 200B devices connected to the internet, today there’s just 2 to 3B devices connected.

Pivotal’s debut

Paul Maritz, Pivotal CEO got up and took us through the Pivotal story. Essentially they have three components a data fabric, an application development fabric and a cloud fabric. He believes the mobile and internet of things will open up new opportunities for organizations to gain value from their data wherever it may lie, that goes well beyond what’s available today. These activities center around consumer grade technologies  which 1) store and reason over very large amounts of data; 2) use rapid application development; and 3) operate at scale in an entirely automated fashion.

He mentioned that humans are a serious risk to continuous availability. Automation is the answer to the human problem for the “always on”, consumer grade technologies needed in the future.

Parts of Pivotal come from VMware, Greenplum and EMC with some available today in specific components. However by YE they will come out with Pivotal One which will be the first framework with data, app development and cloud fabrics coupled together.

Paul called Pivotal Labs as the special forces of his service organization helping leading tech companies pull together the awesome apps needed for the technology of tomorrow, consisting of Extreme programming, Agile development and very technically astute individuals.  Also, CETAS was mentioned as an analytics-as-a-service group providing such analytics capabilities to gaming companies doing log analysis but believes there’s a much broader market coming.
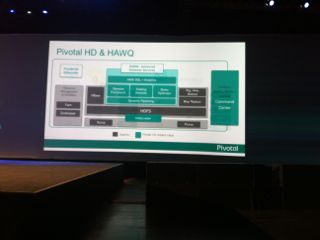
IMG_1393Paul also showed some impressive numbers on their new Pivotal HD/HAWQ offering which showed it handled many more queries than Hive and Cloudera/Impala. In essence, parts of Pivotal are available today but later this year the whole cloud-app dev-big data framework will be released for the first time.

IMG_1401Next up was a media-analyst event where David Goulden, EMC President and COO gave a talk on where EMC has come from and where they are headed from a business perspective.

Then he and Joe did a Q&A with the combined media and analyst community.  The questions were mostly on the financial aspects of the company rather than their technology, but there will be a more focused Q&A session tomorrow with the analyst community.

IMG_1403 Joe was asked about Vblock status. He said last quarter they announced it had reached a $1B revenue run rate which he said was the fastest in the industry.  Joe mentioned EMC is all about choice, such as Vblock different product offerings, VSpex product offerings and now with ViPR providing more choice in storage.

Sometime today Joe had mentioned that they don’t really do custom hardware anymore.  He said of the 13,000 engineers they currently have ~500 are hardware engineers. He also mentioned that they have only one internally designed ASIC in current shipping product.

Then Paul got up and did a Q&A on Pivotal.  He believes there’s definitely an opportunity in providing services surrounding big data and specifically mentioned CETAS as offering analytics-as-a-service as well as Pivotal Labs professional services organization.  Paul hopes that Pivotal will be $1B revenue company in 5yrs.  They already have $300M so it’s well on its way to get there.

IMG_1406Next, there was a very interesting media and analyst session that was visually stimulating from Jer Thorp, co-founder of The Office for Creative Research. And about the best way to describe him is he is a data visualization scientist.

IMG_1409He took some NASA Kepler research paper with very dry data and brought it to life. Also he did a number of analyzes of public Twitter data and showed twitter user travel patterns, twitter good morning analysis, twitter NYT article Retweetings, etc.  He also showed a video depicting people on airplanes around the world. He said it is a little known fact but over a million people are in the air at any given moment of the day.

Jer talked about the need for data ethics and an informed data ownership discussion with people about the breadcrumbs they leave around in the mobile connected world of today. If you get a chance, you should definitely watch his session.IMG_1410

Next Juergen Urbanski, CTO T-Systems got up and talked about the importance of Hadoop to what they are trying to do. He mentioned that in 5 years, 80% of all new data will land on Hadoop first.  He showed how Hadoop is entirely different than what went before and will take T-Systems in vastly new directions.

Next up at EMCworld main hall was Pat Gelsinger, VMware CEO’s keynote on VMware.  The story was all about Software Defined Data Center (SDDC) and the components needed to make this happen.   He said data was the fourth factor of production behind land, capital and labor.

Pat said that networking was becoming a barrier to the realization of SDDC and that they had been working on it for some time prior to the Nicera acquisition. But now they are hard at work merging the organic VMware development with Nicera to create VMware NSX a new software defined networking layer that will be deployed as part of the SDDC.

Pat also talked a little bit about how ViPR and other software defined storage solutions will provide the ease of use they are looking for to be able to deploy VMs in seconds.

Pat demo-ed a solution specifically designed for Hadoop clusters and was able to configure a hadoop cluster with about 4 clicks and have it start deploying. It was going to take 4-6 minutes to get it fully provisioned so they had a couple of clusters already configured and they ran a pseudo Hadoop benchmark on it using visual recognition and showed how Vcenter could be used to monitor the cluster in real time operations.

Pat mentioned that there are over 500,000 physical servers running Hadoop. Needless to say VMware sees this as a prime opportunity for new and enhanced server virtualization capabilities.

That’s about it for the major keynotes and media sessions from today.

Tomorrow looks to be another fun day.

Big science/big data ENCODE project decodes “Junk DNA”

Project ENCODE (ENCyclopedia of DNA Elements) results were recently announced. The ENCODE project was done by a consortium of over 400 researchers from 32 institutions and has deciphered the functionality of so called Junk DNA in the human genome. They have determined that junk DNA is actually used to regulate gene expression.  Or junk DNA is really on-off switches for protein encoding DNA.  ENCODE project results were published by Nature,  Scientific American, New York Times and others.

The paper in Nature ENCODE Explained is probably the best introduction to  the project. But probably the best resource on the project computational aspects comes from these papers at Nature, The making of ENCODE lessons for BIG data projects by Ewan Birney and ENCODE: the human encyclopedia by Brendan Maher.

I have been following the Bioinformatics/DNA scene for some time now. (Please see Genome Informatics …, DITS, Codons, & Chromozones …, DNA Computing …, DNA Computing … – part 2).  But this is perhaps the first time it has all come together to explain the architecture of DNA and potentially how it all works together to define a human.

Project ENCODE results

It seems like there were at least four major results from the project.

  • Junk DNA is actually programming for protein production in a cell.  Scientists previously estimated that <3% of human DNA’s over 3 billion base pairs encode for proteins.  Recent ENCODE results seem to indicate that at least 9% of this human DNA and potentially, as much as 50% provide regulation for when to use those protein encoding DNA.
  • Regulation DNA undergoes a lot of evolutionary drift. That is it seems to be heavily modified across species. For instance, protein encoding genes seem to be fairly static and differ very little between species. On the the other hand, regulating DNA varies widely between these very same species.  One downside to all this evolutionary variation is that regulatory DNA also seems to be the location for many inherited diseases.
  • Project ENCODE has further narrowed the “Known Unknowns” of human DNA.  For instance, about 80% of human DNA is transcribed by RNA. Which means on top of the <3% protein encoding DNA and ~9-50% regulation DNA already identified, there is another 68 to 27% of DNA that do something important to help cells transform DNA into life giving proteins. What that residual DNA does is TBD and is subject for the next phase of the ENCODE project (see below).
  • There are cell specific regulation DNA.  That is there are regulation DNA that are specifically activated if it’s bone cell, skin cell, liver cell, etc.  Such cell specific regulatory DNA helps to generate the cells necessary to create each of our organs and regulate their functions.  I suppose this was a foregone conclusion but it’s proven now

There are promoter regulatory DNA which are located ahead and in close proximity to the proteins that are being encoded and enhancer/inhibitor regulatory DNA which are located a far DNA distance away from the proteins they regulate.

I believe it seems that we are seeing two different evolutionary time frames being represented in the promoter vs. enhancer/inhibitor regulatory DNA.  Whereas promoter DNA seem closely associated with protein encoding DNA, the enhancer DNA seems more like patches or hacks that fixed problems in the original promoter-protein encoding DNA sequences, sort of like patch Tuesday DNA that fixes problems with the original regulation activity.

While I am excited about Project ENCODE results. I find the big science/big data aspects somewhat more interesting.

Genome Big Science/Big Data at work

Some stats from the ENCODE Project:

  • Almost 1650 experiments on around 180 cell types were conducted to generate data for the ENCODE project.   All told almost 12,000 files were analyzed from these experiments.
  • 15TB of data were used in the project
  • ENCODE project internal Wiki had 18.5K page edits and almost 250K page views.

With this much work going on around the world, data quality control was a necessary, ongoing consideration.   It took about half way into the project before they figured out  how to define and assess data quality from experiments.   What emerged from this was a set of published data standards (see data quality UCSC website) used to determine if experimental data were to be accepted or rejected as input to the project.  In the end the retrospectively applied the data quality standards to the earlier experiments and had to jettison some that were scientifically important but exhibited low data quality.

There was a separation between the data generation team (experimenters) and the data analysis team.  The data quality guidelines represented a key criteria that governed these two team interactions.

Apparently the real analysis began when they started layering the base level experiments on top of one another.  This layering activity led to researchers further identifying the interactions and associations between regulatory DNA and protein encoding DNA.

All the data from the ENCODE project has been released and are available to anyone interested. They also have provided a search and browser capability for the data. All this can be found on the top UCSC website. Further, from this same site one can download the software tools used to analyze, browse and search the data if necessary.

This multi-year project had an interesting management team that created a “spine of leadership”.  This team consisted of a few leading scientists and a few full time scientifically aware project officers that held the project together, pushed it along and over time delivered the results.

There were also a set of elaborate rules that were crafted so that all the institutions, researchers and management could interact without friction.  This included rules guiding data quality (discussed above), codes of conduct, data release process, etc.

What no Hadoop?

What I didn’t find was any details on the backend server, network or storage used by the project or the generic data analysis tools.  I suspect Hadoop, MapReduce, HBase, etc. were somehow involved but could find no reference to this.

I expected with the different experiments and wide variety of data fusion going on that there would be some MapReduce scripting that would transcribe the data so it could be further analyzed by other project tools.  Alas, I didn’t find any information about these tools in the 30+ research papers that were published in the last week or so.

It looks like the genomic analysis tools used in the ENCODE project are all open source. They useh the OpenHelix project deliverables.  But even a search of the project didn’t reveal any hadoop references.

~~~~

The ENCODE pilot project (2003-2007) cost ~$53M, the full ENCODE project’s recent results cost somewhere around $130M and they are now looking to the next stage of the ENCODE project estimated to cost ~$123M.  Of course there are 1000s of more human cell types that need to be examined and ~30% more DNA that needs to be figured out. But this all seems relatively straight forward now that the ENCODE project has laid out an architectural framework for human DNA.

Anyone out there that knows more about the data processing/data analytics side of the ENCODE project please drop me a line.  I would love to hear more about it or you can always comment here.

Comments?

Image: From Project Encode, Credits: Darryl Leja (NHGRI), Ian Dunham (EBI)

Archeology meets Big Data

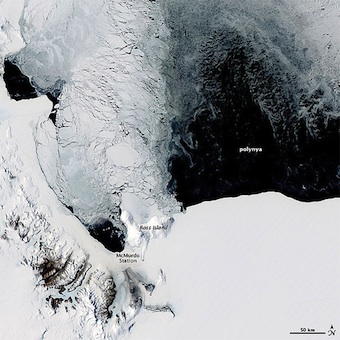
Polynya off the Antarctic Coast by NASA Earth Observatory (cc) (From Flickr)

Read an article yesterday about the use of LIDAR (light detection and ranging, Wikipedia) to map the residues of an pre-columbian civilization in Central America, the little know Purepecha empire, peers of the Aztecs.

The original study (seeLIDAR at Angamuco) cited in the piece above was a result of the Legacies of Resilience project sponsored by Colorado State University (CSU) and goes into some detail about the data processing and archeological use of the LIDAR maps.

Why LIDAR?

LIDAR sends a laser pulse from an airplane/satellite to the ground and measures how long it takes to reflect back to the receiver. With that information and “some” data processing, these measurements can be converted to an X, Y, & Z coordinate system or detailed map of the ground.

The archeologists in the study used LIDAR to create a detailed map of the empire’s main city at a resolution of +/- 0.25m (~10in). They mapped about ~207 square kilometers (80 square miles) at this level of detail. In 4 days of airplane LIDAR mapping, they were able to gather more information about the area then they were able to accumulate over 25 years of field work. Seems like digital archeology was just born.

So how much data?

I wanted to find out just how much data this was but neither the article or the study told me anything about the size of the LIDAR map. However, assuming this is a flat area, which it wasn’t, and assuming the +/-.25m resolution represents a point every 625sqcm, then the area being mapped above should represent a minimum of ~3.3 billion points of a LIDAR point cloud.

Another paper I found (see Evaluation of MapReduce for Gridding LIDAR Data) said that a LIDAR “grid point” (containing X, Y & Z coordinates) takes 52 bytes of data.

Given the above I estimate the 207sqkm LIDAR grid point cloud represents a minimum of ~172GB of data. There are LIDAR compression tools available, but even at 50% reduction, it’s still 85GB for 210sqkm.

My understanding is that the raw LIDAR data would be even bigger than this and the study applied a number of filters against the LIDAR map data to extract different types of features which of course would take even more space. And that’s just one ancient city complex.

With all the above the size of LIDAR raw data, grid point fields, and multiple filtered views is approaching significance (in storage terms). Moving and processing all this data must also be a problem. As evidence, the flights for the LIDAR runs over Angamuco, Mexico occurred in January 2011 and they were able to analyze the data sometime that summer, ~6 months late. Seems a bit long from my perspective maybe the data processing/analysis could use some help.

Indiana Jones meets Hadoop

That was the main subject of the second paper mentioned above done by researchers at the San Diego Supercomputing Center (SDSC). They essentially did a benchmark comparing MapReduce/Hadoop running on a relatively small cluster of 4 to 8 commodity nodes against an HPC cluster (running 28-Sun x4600M2 servers, using 8 processor, quad core nodes, with anywhere from 256 GB to 512GB [only on 8 nodes] of DRAM running a C++ implementation of the algorithm.

The results of their benchmarks were that the HPC cluster beat the Hadoop cluster only when all of the LIDAR data could fit in memory (on a DRAM per core basis), after that the Hadoop cluster performed just as well in elapsed wall clock time. Of course from a cost perspective the Hadoop cluster was much more economical.

The 8-node, Hadoop cluster was able to “grid” a 150M LIDAR derived point cloud at the 0.25m resolution in just a bit over 10 minutes. Now this processing step is just one of the many steps in LIDAR data analysis but it’s probably indicative of similar activity occurring earlier and later down the (data) line.

~~~~

Let’s see 172GB per 207sqkm, the earth surface is 510Msqkm, says a similar resolution LIDAR grid point cloud of the entire earth’s surface would be about 0.5EB (Exabyte, 10**18 bytes). It’s just great to be in the storage business.


eBay cools Phoenix data center with hot water from the desert

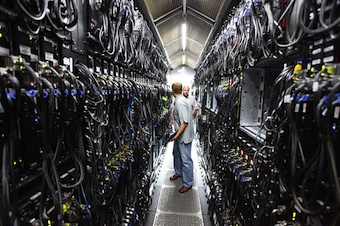
Two people talking to one another in a data center hallway about one person wide with bunches of racks and cabling on either side
Microsoft Bing Maps' datacenter by Robert Scoble

Read a report today about how eBay was cooling their new data center outside Phoenix with hot water at desert warmed 86F (30C) temperatures (see Breaking new ground on data center efficiency).

And to literally top it all off, they are running data center containers on the roof which they claim have a Green Grid’s PUE™ (Power Use Efficiency) of 1.044 in summer with servers at maximum load.  Now this doesn’t count some of the transformers and other power conditioning that is needed but is still impressive nevertheless.

The average for the whole data center a PUE of 1.35 is not the best in the industry but considerably better than average.  We have talked about green data centers before with a NetApp data center having an expected PUE of 1.2 (see Building a green data center).  One secret to these PUE’s is running the servers at hotter than normal temperatures.

New data center designed, servers and other equipment selected with PUE in mind

This is a data center consolidation project so they were also able to start with a blank sheet of paper.  They started by reducing the number of server types down to two, one for high performance computing and the other for big data analytics (Hadoop cluster).  Both sets of servers were selected with power efficiency in mind.  Another server capability requested by eBay was the ability to dynamically change server clock speed so it could idle or speed up servers as demand dictated. In this way they could turn down servers sheding power consumption and/or turn up servers to peak performance, remotely.

The data center cooling was designed with two independent loops, one a traditional  standard air conditioned loop that delivered water at 55F(13C) and the other, a hot water loop that delivered hot water 86F(30C), using water from a cooling tower exposed to the desert air.

eBay started out thinking they would use the air conditioned loop more often in the summer months and less often in winter. But in the end they found they could get by with just using the hot water loop year round and use the cold water loop for some spot cooling, where necessary.

Data center containers on a hot roof

Also the building was specially built to be able to support up to 12-data center containers on the roof.  There were over 4920 servers deployed in three containers currently on the roof and one container of 1500 servers was lifted from the truck and in place in 22 minutes. The containers were designed for direct exposure the desert environment (up tho 122F or 50C) and were cooled using adiabatic cooling.

More details are available in the Green Grid report.

~~~~~~

I wonder what they do when they have to swap out components, especially in the containers – maybe they only do this in winter;)

Comments?

Intel acquires InfiniBand fabric technology from Qlogic

Isilon Packaging by ChrisDag (cc) (from Flickr)”][InfiniBand interconnected] Isilon Packaging by ChrisDag (cc) (from Flickr)Intel announced today that they are going to acquire the InfiniBand (IB) fabric technology business from Qlogic.

From many analyst’s perspective, IB is one of the only technologies out there that can efficiently interconnect a cluster of commodity servers into a supercomputing system.

What’s InfiniBand?

Recall that IB is one of three reigning data center fabric technologies available today which include 10GbE, and 16 Gb/s FC.  IB is currently available in DDR, QDR and FDR modes of operation, that is 5Gb/s, 10Gb/s or 14Gb/s, respectively per single lane, according to the IB update (see IB trade association (IBTA) technology update).  Systems can aggregate multiple IB lanes in units of 4 or 12 paths (see wikipedia IB article), such that an IB QDRx4 supports 40Gb/s and a IB FDRx4 currently supports 56Gb/s.

The IBTA pitch cited above showed that IB is the most widely used interface for the top supercomputing systems and supports the most power efficient interconnect available (although how that’s calculated is not described).

Where else does IB make sense?

One thing IB has going for it is low latency through the use of RDMA or remote direct memory access.  That same report says that an SSD directly connected through a FC takes about ~45 μsec to do a read whereas the same SSD directly connected through IB using RDMA would only take ~26 μsec.

However, RDMA technology is now also coming out on 10GbE through RDMA over Converged Ethernet (RoCE, pronounced “rocky”).  But ITBA claims that IB RDMA has a 0.6 μsec latency and the RoCE has a 1.3 μsec.  Although at these speed, 0.7 μsec doesn’t seem to be a big thing, it doubles the latency.

Nonetheless, Intel’s purchase is an interesting play.  I know that Intel is focusing on supporting an ExaFLOP HPC computing environment by 2018 (see their release).  But IB is already a pretty active technology in the HPC community already and doesn’t seem to need their support.

In addition, IB has been gradually making inroads into enterprise data centers via storage products like the Oracle Exadata Storage Server using the 40 Gb/s IB QDRx4 interconnects.  There are a number of other storage products out that use IB as well from EMC IsilonSGI, Voltaire, and others.

Of course where IB can mostly be found today is in computer to computer interconnects and just about every server vendor out today, including Dell, HP, IBM, and Oracle support IB interconnects on at least some of their products.

Whose left standing?

With Qlogic out I guess this leaves Cisco (de-emphasized lately), Flextronix, Mellanox, and Intel as the only companies that supply IB switches. Mellanox, Intel (from Qlogic) and Voltaire supply the HCA (host channel adapter) cards which provide the server interface to the switched IB network.

Probably a logical choice for Intel to go after some of this technology just to keep it moving forward and if they want to be seriously involved in the network business.

IB use in Big Data?

On the other hand, it’s possible that Hadoop and other big data applications could conceivably make use of IB speeds and as these are mainly vast clusters of commodity systems it would be a logical choice.

There is some interesting research on the advantages of IB in HDFS (Hadoop) system environments (see Can high performance interconnects boost Hadoop distributed file system performance) out of Ohio State University.  This research essentially says that Hadoop HDFS can perform much better when you combine IB with IPoIB (IP over IB, see OpenFabrics Alliance article) and SSDs.  But SSDs alone do not provide as much benefit.   (Although my reading of the performance charts seems to indicate it’s not that much better than 10GbE with TOE?).

It’s possible other Big data analytics engines are considering using IB as well.  It would seem to be a logical choice if you had even more control over the software stack.

~~~~

Comments?


Big data and eMedicine combine to improve healthcare

fix_me by ~! (cc) (from Flickr)

We have talked before ePathology and data growth, but Technology Review recently reported that researchers at Stanford University have used Electronic Medical Records (EMR) from multiple medical institutions to identify a new harmful drug interaction. Apparently, they found that when patients take Paxil (a depressant) and Pravachol (a cholresterol reducer) together, the drugs interact to raise blood sugar similar to what diabetics have.

Data analytics to the rescue

The researchers started out looking for new drug interactions which could result in conditions seen by diabetics. Their initial study showed a strong signal that taking both Paxil and Pravachol could be a problem.

Their study used FDA Adverse Event Reports (AERs) data that hospitals and medical care institutions record.  Originally, the researchers at Stanford’s Biomedical Informatics group used AERs available at Stanford University School of Medicine but found that although they had a clear signal that there could be a problem, they didn’t have sufficient data to statistically prove the combined drug interaction.

They then went out to Harvard Medical School and Vanderbilt University and asked that to access their AERs to add to their data.  With the combined data, the researchers were now able to clearly see and statistically prove the adverse interactions between the two drugs.

But how did they analyze the data?

I could find no information about what tools the biomedical informatics researchers used to analyze the set of AERs they amassed,  but it wouldn’t surprise me to find out that Hadoop played a part in this activity.  It would seem to be a natural fit to use Hadoop and MapReduce to aggregate the AERs together into a semi-structured data set and reduce this data set to extract the AERs which matched their interaction profile.

Then again, it’s entirely possible that they used a standard database analytics tool to do the work.  After all, we were only talking about a 100 to 200K records or so.

Nonetheless, the Technology Review article stated that some large hospitals and medical institutions using EMR are starting to have database analysts (maybe data scientists) on staff to mine their record data and electronic information to help improve healthcare.

Although EMR was originally envisioned as a way to keep better track of individual patients, when a single patient’s data is combined with 1000s more patients one creates something entirely different, something that can be mined to extract information.  Such a data repository can be used to ask questions about healthcare inconceivable before.

—-

Digitized medical imagery (X-Rays, MRIs, & CAT scans), E-pathology and now EMR are together giving rise to a new form of electronic medicine or E-Medicine.  With everything being digitized, securely accessed and amenable to big data analytics medical care as we know is about to undergo a paradigm shift.

Big data and eMedicine combined together are about to change healthcare for the better.

IBM’s 120PB storage system

Susitna Glacier, Alaska by NASA Goddard Photo and Video (cc) (from Flickr)

Talk about big data, Technology Review reported this week that IBM is building a 120PB storage system for some unnamed customer.  Details are sketchy and I cannot seem to find any announcement of this on IBM.com.

Hardware

It appears that the system uses 200K disk drives to support the 120PB of storage.  The disk drives are packed in a new wider rack and are water cooled.  According to the news report the new wider drive trays hold more drives than current drive trays available on the market.

For instance, HP has a hot pluggable, 100 SFF (small form factor 2.5″) disk enclosure that sits in 3U of standard rack space.  200K SFF disks would take up about 154 full racks, not counting the interconnect switching that would be required.  Unclear whether water cooling would increase the density much but I suppose a wider tray with special cooling might get you more drives per floor tile.

There was no mention of interconnect, but today’s drives use either SAS or SATA.  SAS interconnects for 200K drives would require many separate SAS busses. With an SAS expander addressing 255 drives or other expanders, one would need at least 4 SAS busses but this would have ~64K drives per bus and would not perform well.  Something more like 64-128 drives per bus would have much better performer and each drive would need dual pathing, and if we use 100 drives per SAS string, that’s 2000 SAS drive strings or at least 4000 SAS busses (dual port access to the drives).

The report mentioned GPFS as the underlying software which supports three cluster types today:

  • Shared storage cluster – where GPFS front end nodes access shared storage across the backend. This is generally SAN storage system(s).  But the requirements for high density, it doesn’t seem likely that the 120PB storage system uses SAN storage in the backend.
  • Networked based cluster – here the GPFS front end nodes talk over a LAN to a cluster of NSD (network storage director?) servers which can have access to all or some of the storage. My guess is this is what will be used in the 120PB storage system
  • Shared Network based clusters – this looks just like a bunch of NSD servers but provides access across multiple NSD clusters.

Given the above, with ~100 drives per NSD server means another 1U extra per 100 drives or (given HP drive density) 4U per 100 drives for 1000 drives and 10 IO servers per 40U rack, (not counting switching).  At this density it takes ~200 racks for 120PB of raw storage and NSD nodes or 2000 NSD nodes.

Unclear how many GPFS front end nodes would be needed on top of this but even if it were 1 GPFS frontend node for every 5 NSD nodes, we are talking another 400 GPFS frontend nodes and at 1U per server, another 10 racks or so (not counting switching).

If my calculations are correct we are talking over 210 racks with switching thrown in to support the storage.  According to IBM’s discussion on the Storage challenges for petascale systems, it probably provides ~6TB/sec of data transfer which should be easy with 200K disks but may require even more SAS busses (maybe ~10K vs. the 2K discussed above).

Software

IBM GPFS is used behind the scenes in IBM’s commercial SONAS storage system but has been around as a cluster file system designed for HPC environments for over 15 years or more now.

Given this many disk drives something needs to be done about protecting against drive failure.  IBM has been talking about declustered RAID algorithms for their next generation HPC storage system which spreads the parity across more disks and as such, speeds up rebuild time at the cost of reducing effective capacity. There was no mention of effective capacity in the report but this would be a reasonable tradeoff.  A 200K drive storage system should have a drive failure every 10 hours, on average (assuming a 2 million hour MTBF).  Let’s hope they get drive rebuild time down much below that.

The system is expected to hold around a trillion files.  Not sure but even at 1024 bytes of metadata per file, this number of files would chew up ~1PB of metadata storage space.

GPFS provides ILM (information life cycle management, or data placement based on information attributes) using automated policies and supports external storage pools outside the GPFS cluster storage.  ILM within the GPFS cluster supports file placement across different tiers of storage.

All the discussion up to now revolved around homogeneous backend storage but it’s quite possible that multiple storage tiers could also be used.  For example, a high density but slower storage tier could be combined with a low density but faster storage tier to provide a more cost effective storage system.  Although, it’s unclear whether the application (real world modeling) could readily utilize this sort of storage architecture nor whether they would care about system cost.

Nonetheless, presumably an external storage pool would be a useful adjunct to any 120PB storage system for HPC applications.

Can it be done?

Let’s see, 400 GPFS nodes, 2000 NSD nodes, and 200K drives. Seems like the hardware would be readily doable (not sure why they needed watercooling but hopefully they obtained better drive density that way).

Luckily GPFS supports Infiniband which can support 10,000 nodes within a single subnet.  Thus an Infiniband interconnect between the GPFS and NSD nodes could easily support a 2400 node cluster.

The only real question is can a GPFS software system handle 2000 NSD nodes and 400 GPFS nodes with trillions of files over 120PB of raw storage.

As a comparison here are some recent examples of scale out NAS systems:

It would seem that a 20X multiplier times a current Isilon cluster or even a 10X multiple of a currently supported SONAS system would take some software effort to work together, but seems entirely within reason.

On the other hand, Yahoo supports a 4000-node Hadoop cluster and seems to work just fine.  So from a feasability perspective, a 2500 node GPFS-NSD node system seems just a walk in the park for Hadoop.

Of course, IBM Almaden is working on project to support Hadoop over GPFS which might not be optimum for real world modeling but would nonetheless support the node count being talked about here.

——

I wish there was some real technical information on the project out on the web but I could not find any. Much of this is informed conjecture based on current GPFS system and storage hardware capabilities. But hopefully, I haven’t traveled to far astray.

Comments?


Shared DAS

Code Name "Thumper" by richardmasoner (cc) (from Flickr)

An announcement this week by VMware on their vSphere  5 Virtual Storage Appliance has brought back the concept of shared DAS (see vSphere 5 storage announcements).

Over the years, there have been a few products, such as Seanodes and Condor Storage (may not exist now) that have tried to make a market out of sharing DAS across a cluster of servers.

Arguably, Hadoop HDFS (see Hadoop – part 1), Amazon S3/cloud storage services and most scale out NAS systems all support similar capabilities. Such systems consist of a number of servers with direct attached storage, accessible by other servers or the Internet as one large, contiguous storage/file system address space.

Why share DAS? The simple fact is that DAS is cheap, its capacity is increasing, and it’s ubiquitous.

Shared DAS system capabilities

VMware has limited their DAS virtual storage appliance to a 3 ESX node environment, possibly lot’s of reasons for this.  But there is no such restriction for Seanode Exanode clusters.

On the other hand, VMware has specifically targeted SMB data centers for this facility.  In contrast, Seanodes has focused on both HPC and SMB markets for their shared internal storage which provides support for a virtual SAN on Linux, VMware ESX, and Windows Server operating systems.

Although VMware Virtual Storage Appliance and Seanodes do provide rudimentary SAN storage services, they do not supply advanced capabilities of enterprise storage such as point-in-time copies, replication, data reduction, etc.

But, some of these facilities are available outside their systems. For example, VMware with vSphere 5 will supports a host based replication service and has had for some time now software based snapshots. Also, similar services exist or can be purchased for Windows and presumably Linux.  Also, cloud storage providers have provided a smattering of these capabilities from the start in their offerings.

Performance?

Although distributed DAS storage has the potential for high performance, it seems to me that these systems should perform poorer than an equivalent amount of processing power and storage in a dedicated storage array.  But my biases might be showing.

On the other hand, Hadoop and scale out NAS systems are capable of screaming performance when put together properly.  Recent SPECsfs2008 results for EMC Isilon scale out NAS system have demonstrated very high performance and Hadoops claim to fame is high performance analytics. But you have to throw a lot of nodes at the problem.

—–

In the end, all it takes is software. Virtualizing servers, sharing DAS, and implementing advanced storage features, any of these can be done within software alone.

However, service levels, high availability and fault tolerance requirements have historically necessitated a physical separation between storage and compute services. Nonetheless, if you really need screaming application performance and software based fault tolerance/high availability will suffice, then distributed DAS systems with co-located applications like Hadoop or some scale out NAS systems are the only game in town.

Comments?